From Facts to Foresight: Rethinking the Knowledge Graph for Financial Markets

Fig 1: Fixed entities, flowing events — the world as it actually behaves.
If you've used Wikipedia, Google Search, or asked a chatbot a factual question, you've already used a knowledge graph. The technology powers the panel on the right side of your search results, the "people also ask" suggestions, and the entity cards on news sites. It's everywhere — and yet, for the people we built FinCatch for, it has always come up short.
This post is about why we built our own, what makes it different, and how it changes the work of financial research.
What a "Common" Knowledge Graph Looks Like
The classic knowledge graph is an encyclopedia in a different shape. It stores things and the relationships between them. Apple Inc. is a company. It is headquartered in Cupertino. Tim Cook is its CEO. The S&P 500 contains it. These are facts, neatly connected, and a query engine can hop between them in milliseconds.
This is a brilliant model for trivia, recommendations, and search. But it has a quiet assumption baked into it: that the world is mostly static, and that what matters is what something is — not what is happening to it.
For an investor, that assumption breaks immediately.
What Investors Actually Need
An analyst doesn't sit down in the morning wondering whether Tesla is a company or where it's headquartered. They want to know:
- What happened in the last 24 hours that I should care about?
- How does this earnings miss compare to the last four quarters?
- Which other companies share the same supply chain risk?
- Is this the start of a pattern, or a one-off?
- What narrative is the market telling itself right now?
These aren't questions about facts. They're questions about events, relationships under stress, and signals over time. A traditional knowledge graph can store the company and the country and the sector — but it has no native language for a guidance cut that was followed by a CFO departure that was followed by an analyst downgrade. That sequence is the world the buy side lives in, and it's invisible to a graph built around static entities.
Our Approach: An Event-Centric Graph
We built FinCatch's knowledge graph around a different center of gravity. Companies, products, industries, and people still live in the graph — but the gravitational pull is the event.
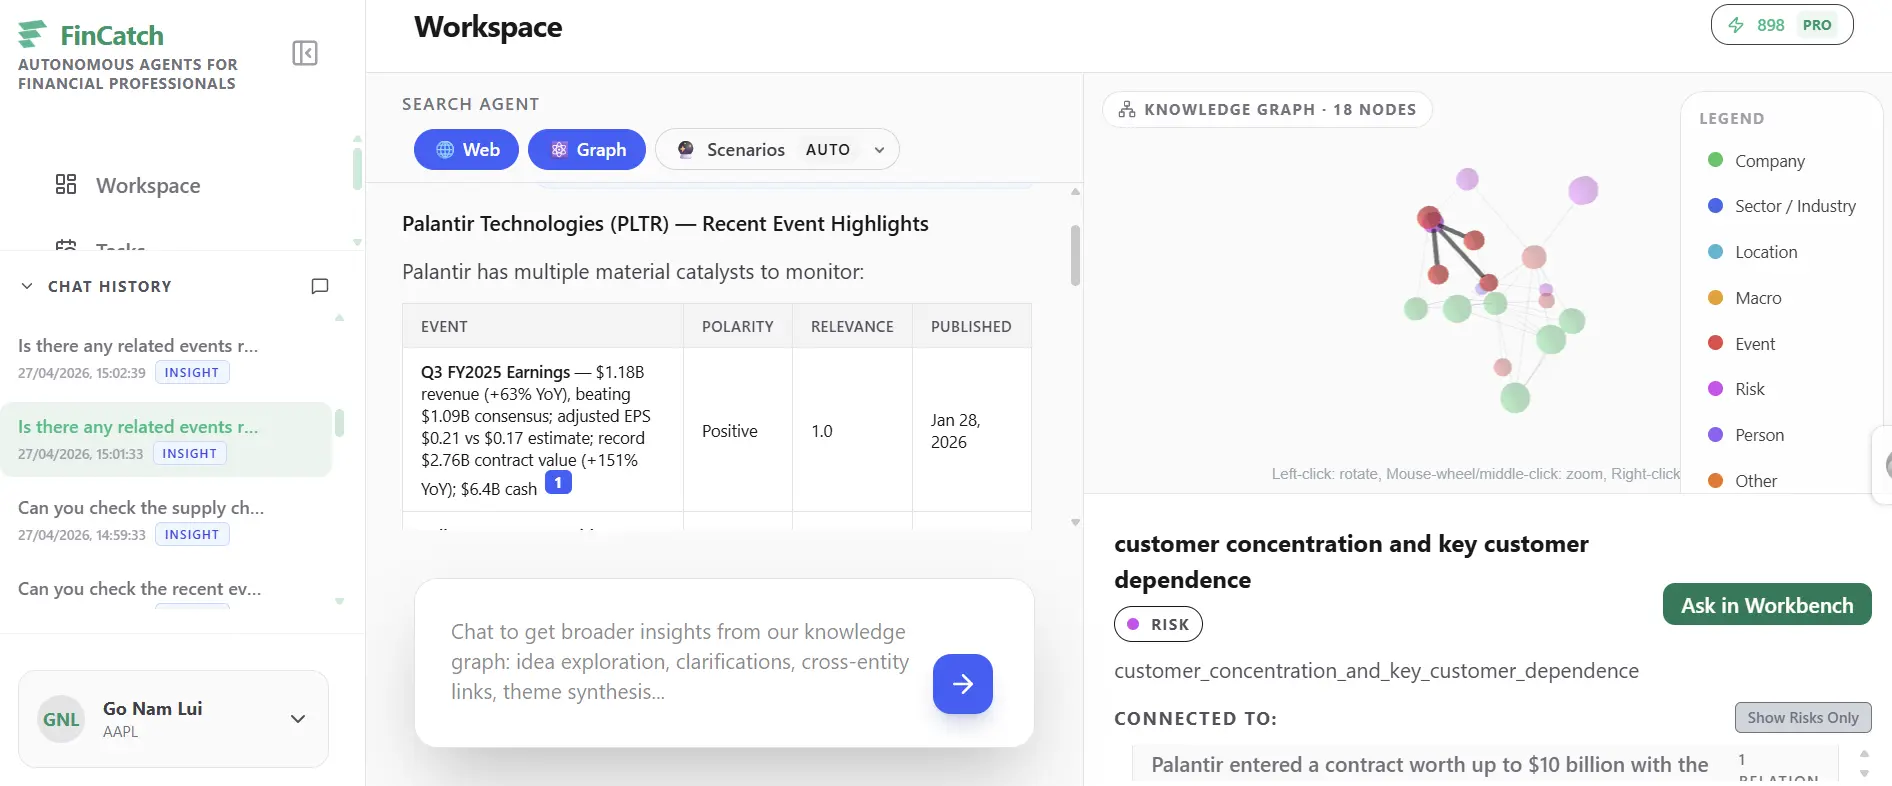
Fig 2: Illustration of FinCatch Graph view.
Every news article, earnings transcript, and regulatory filing we ingest is distilled into structured events: what happened, who it impacted, how certain we are about it, whether it's recurring, whether it's a positive or negative development, and how it connects to other events. An event isn't a headline; it's a unit of meaning that links narratives to companies, sectors, geographies, and risks — and to the events that came before and after it.
That last connection is, in our view, what makes the graph genuinely useful. Events are not isolated. A guidance cut belongs to a sequence; a regulatory action belongs to a wave; an executive departure belongs to a pattern. Our graph captures those sequences as first-class relationships, so an analyst can walk the chain of a story the same way the market does.
Why This Is Hard (And Why It Matters)
The reason most financial knowledge graphs don't work this way is that building one requires solving several problems at once.
Many sources, one truth. One vendor calls a company "Meta." Another calls it "Meta Platforms Inc." A transcript refers to it as "the company." A regulatory filing identifies it by an opaque agency code. A common knowledge graph creates three or four disconnected nodes for the same thing. Ours resolves them into one — using a layered process that starts with exact identifiers, falls back to meaning-based similarity, and brings in a language model only when human-level judgment is required.
Coverage that goes deeper than tickers. The graph doesn't stop at the public-company layer. Industries are modeled with the same hierarchical taxonomy that professional analysts already use. Geography is hierarchical too, so a story about Bavaria correctly rolls up to Germany and to Western Europe without any extra work from the user. People, products, suppliers, peers, institutional holders, and risk factors all live in the same connected structure.
Signals, not just storage. Once the graph is dense enough, it stops being just a place to look things up. We run analytical algorithms across it on a daily cadence to surface which companies are at the center of co-occurring narratives, which clusters are forming, and which relationships are statistically unusual. These computed signals turn the graph into something an analyst can ask open-ended questions of — questions where you don't know the right ticker to start with.
The Pipeline, in Plain Terms
At a high level, four things happen behind the scenes, continuously:
- Collect. A steady stream of news, earnings calls, and filings flows in from across the market.
- Understand. Each document is read by a language model that extracts events, entities, and the relationships between them — with explicit fields for certainty, polarity, and recurrence, not just free text.
- Connect. Every extracted entity is reconciled against the existing graph: the right Apple, the right Bavaria, the right semiconductor sub-industry. Events are linked into chains so that follow-ups attach to their predecessors.
- Signal. Graph-wide computations run across the connected structure to produce factor scores, community groupings, and pair candidates — the layer where research becomes actionable.
The result is a graph that doesn't just tell you the world as it is. It tells you the world as it's moving.

Fig 3: Many sources, one navigable landscape.
What This Unlocks
For our users — analysts, portfolio managers, and the AI research agent we've built on top — the graph turns a question like "what's been happening this week to companies exposed to the European energy market?" into a single traversal, with sources attached and narrative chains preserved.
Claude, Gemini, and Perplexity all now offer finance-focused experiences, and they're genuinely good at what they do: fetching live data and summarizing it on demand. FinCatch is a different kind of system underneath — a persistent graph where events, entities, and their relationships are resolved and linked before you ask, so each question draws on structure the platform has already built rather than text it's reading for the first time.
That's the shift we care about: not from one database technology to another, but from looking up facts to navigating a market in motion.
We'll keep writing about what this enables — how our research agent uses the graph, where the signals come from, and the unexpected places it takes our analysts. If you'd like to see it in action, Get in touch.