Management Guidance Extraction and Analysis
Every quarter, public company management teams give investors a window into the future — specific targets, ranges, and directional expectations for revenue, margins, earnings, and capital allocation. This guidance is among the most actionable information available to equity analysts. Our management guidance workflow automatically extracts these forward-looking statements from earnings call transcripts and press releases, normalizes them into structured, comparable data, and then — once the target quarter arrives — measures how closely reality matched the promise. The goal is to build a factual, time-series record of what management said, what they meant by it, and whether they delivered. Key takeaways from the management guidance workflow include segment-wise performance breakdown for companies and deriving the management's biases.
Where Do We Get the Data From?
We pull from two primary sources for every earnings period: the earnings call transcript and the earnings press release (filed as an SEC 8-K). Both documents cover the same quarter but serve different purposes, and the combination is intentional.
The transcript captures the live, spoken interaction between management and analysts. Prepared remarks offer a curated narrative, but the Q&A section is often where the most revealing guidance surfaces — management teams are pushed for specifics on segment trends, margin trajectories, and capital allocation plans that they might not have volunteered in the press release. The verbatim language is preserved exactly as spoken, including hedging phrases and qualifications, because the choice of words often signals confidence level.
The press release contains the formal financial tables — income statement, cash flow statement, balance sheet — alongside management's written forward outlook. For numeric guidance, the press release is typically the more precise source, since numbers that appear in written form are less prone to transcription error than spoken figures. Where the same guidance appears in both documents, we prefer the transcript because it tends to include more context and reasoning.
One caveat on scope worth flagging up front: for now, this workflow's coverage is limited to US-listed companies, which is why the press release shows up as an 8-K. Foreign issuers — which file the equivalent disclosure as a 6-K — are next on the roadmap.
Some of the numerical items we extract guidance for include:
- Top-line metrics such as Revenue, Gross Profit, Gross Margin.
- Profitability metrics such as Operating Income, Operating Expenses, EBITDA, EPS, etc.
- Capital allocation guidance such as Capex, Free Cash Flow, Share Repurchases.
- Segment and product revenue guidance. For example: Azure Revenue (Microsoft), iPhone Revenue (Apple), etc.
Not only do we extract guidance for numerical items, we also extract management's guidance on future plans such as new product releases, new store openings, and any other factors that may impact profitability.
How We Compare Guidance to Actual Results
When the target quarter arrives and results are reported, we retrieve the guidance items that were pointed at for that period and evaluate them against what actually happened. We score the accuracy (SIGNIFICANTLY MISSED, MISSED, MET, EXCEEDED, SIGNIFICANTLY EXCEEDED) of a prior prediction and record the actual outcome alongside the original target.
For numerical items, the comparison is straightforward. We extract the value of that item from external APIs if available, or by parsing the earnings transcript and the earnings release otherwise. For example: if management guided Q2 revenue of $43.0–$43.5 billion and the company reports $42.1 billion, the assessment records the miss, the magnitude, and the direction. If the actual result was $44.2 billion, it records an upside beat. This is stored consistently across companies and periods so trends become visible over time.
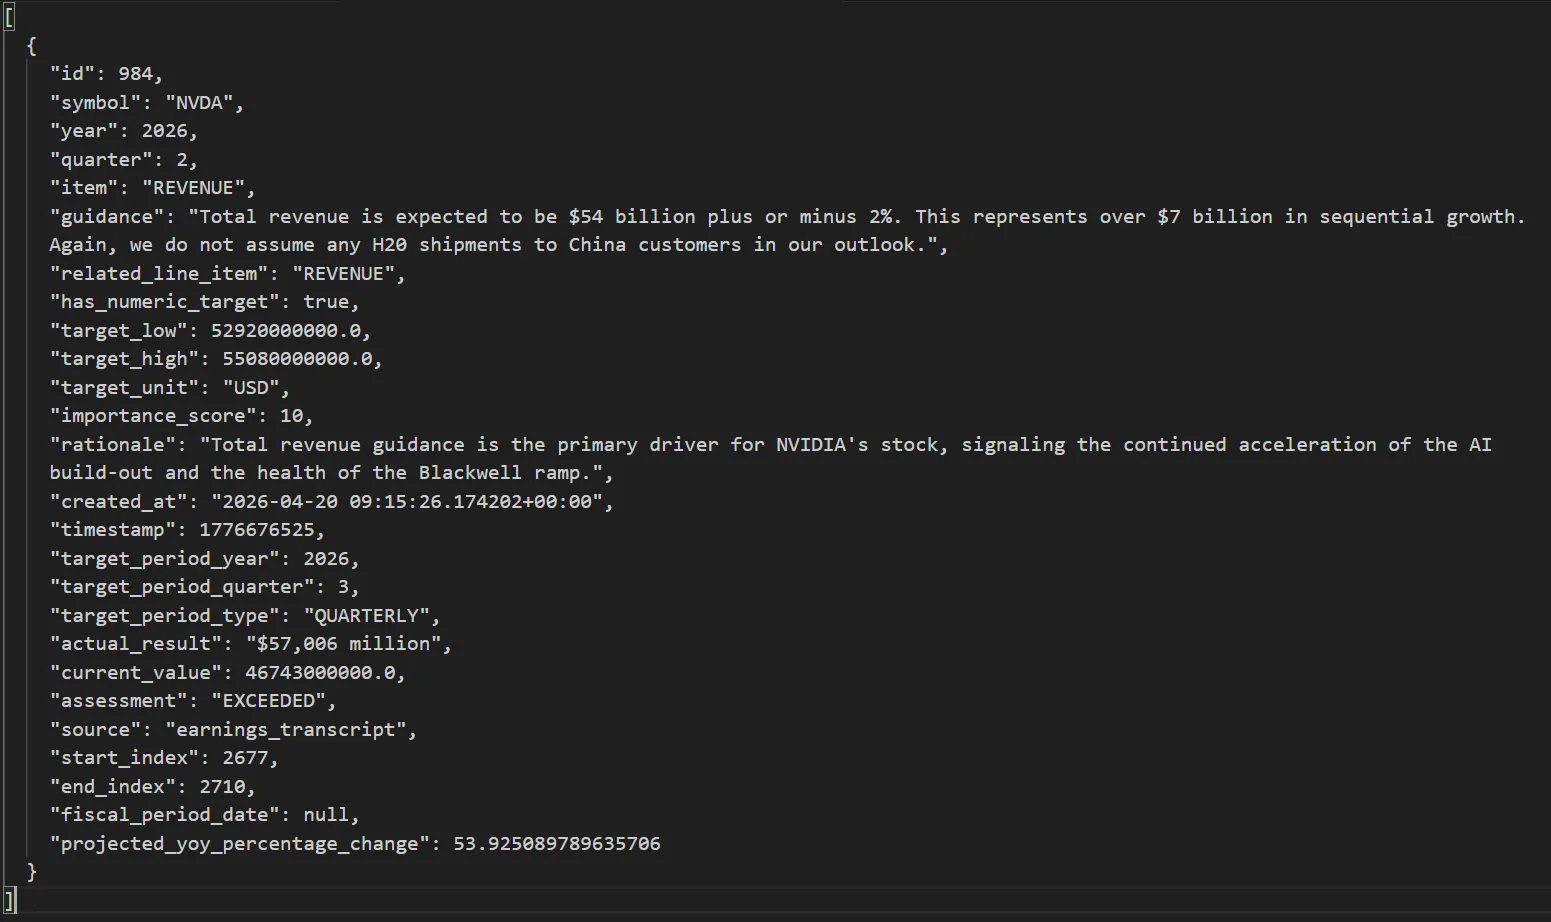
Fig 1: Numerical guidance compared against actual reported results.
For non-numerical items, we look at any mention of the specified item in the transcript or filings, so that we are able to flag missing items or validate whether the management's predictions have come true.
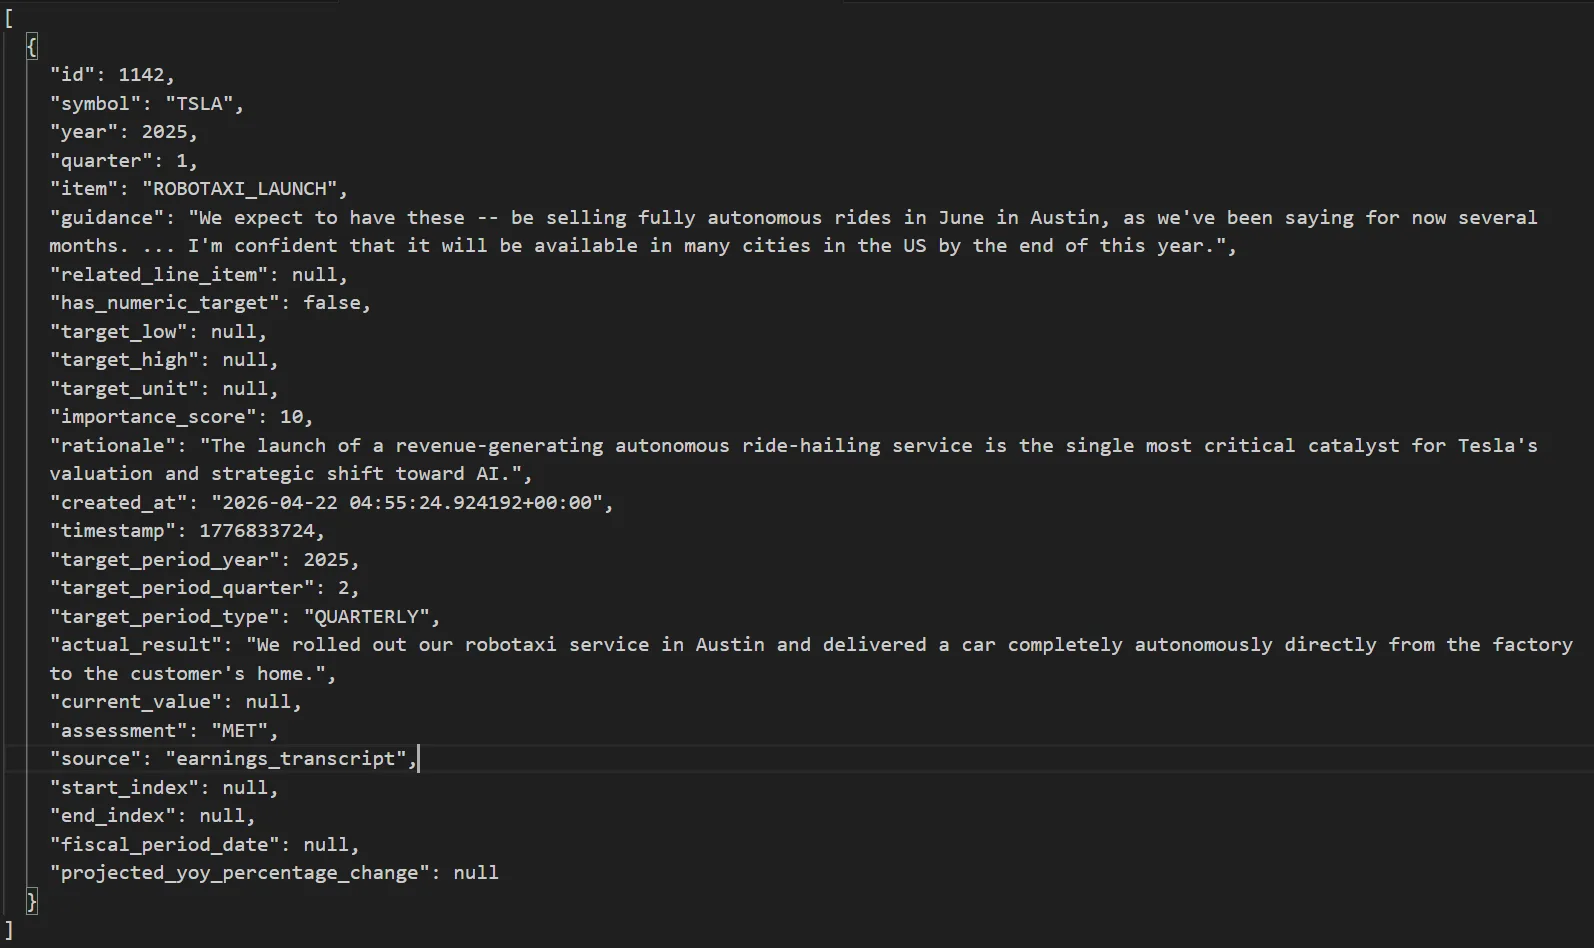
Fig 2: Tracking qualitative, non-numerical guidance items across periods.
Seeing the Trend
Because guidance and assessments are stored quarter over quarter, we can build a track record for each management team across every item they guide. This could reveal the following patterns:
- Sandbagging — a management team that consistently guides conservatively and beats by a predictable margin (e.g., Amazon's operating income guidance has historically been set well below eventual results). Once the pattern is established, the guidance itself becomes less useful as a point estimate, but the degree of underpromise becomes a calibration factor.
- Optimistic drift — teams that guide aggressively and miss systematically, particularly on capex or margin items, signal execution risk or a habit of setting aspirational rather than operational targets.
- Item-specific reliability — a team may be highly accurate on revenue guidance but chronically imprecise on tax rate or share count. Knowing which items have tight historical accuracy helps analysts weight guidance items when building models.
- Guidance regime changes — a sudden shift in guidance style (from specific ranges to qualitative direction, or from quarterly to annual) often precedes a period of uncertainty in the business. The historical record makes these inflection points visible.
How does this benefit forward prediction evaluation?
The practical value of the system is not just historical — it directly improves the quality of forward modelling.
Calibrated inputs, not raw guidance. When we know a management team has beaten revenue guidance by an average of 2.3% over the last eight quarters, we do not simply plug the midpoint of their Q3 guidance into a model. We apply the historical bias adjustment. The system gives us the data to do this quantitatively rather than from intuition.
Integrating guidance into DCF scenarios. Management's explicit capex and free cash flow guidance feeds directly into the normalization and growth assumption pipeline used in DCF modelling. A company that guides $80 billion in capex for the coming year provides a concrete anchor for the capex normalization step — far more reliable than extrapolating from a historical trend. Combined with the accuracy track record, you can assign credibility weights to the guidance before encoding it as a model assumption.
Building conviction asymmetrically. An investor who knows that management has met or exceeded EPS guidance in 11 of the last 12 quarters can size a position more aggressively around earnings. Conversely, a management team with a pattern of missing free cash flow guidance by 20%+ introduces model risk that warrants a wider discount rate or scenario distribution. The guidance track record quantifies what would otherwise be a subjective read on management quality.
Presenting Results to the User
When the FinCatch agent runs a management guidance analysis, it returns two complementary artifacts: a set of interactive charts that visualise the historical guidance-versus-actuals record, and a written report that summarises management's confidence, their delivery track record, and the implications going forward.
For every numerical item, we plot a chart that spans the most recent quarters, with the guided range, midpoint, and actual outcome shown side by side. The goal is to make the underlying pattern legible at a glance — whether management has consistently sandbagged, drifted optimistic, or tracked reality closely — without the analyst having to reconstruct it from a table of numbers.
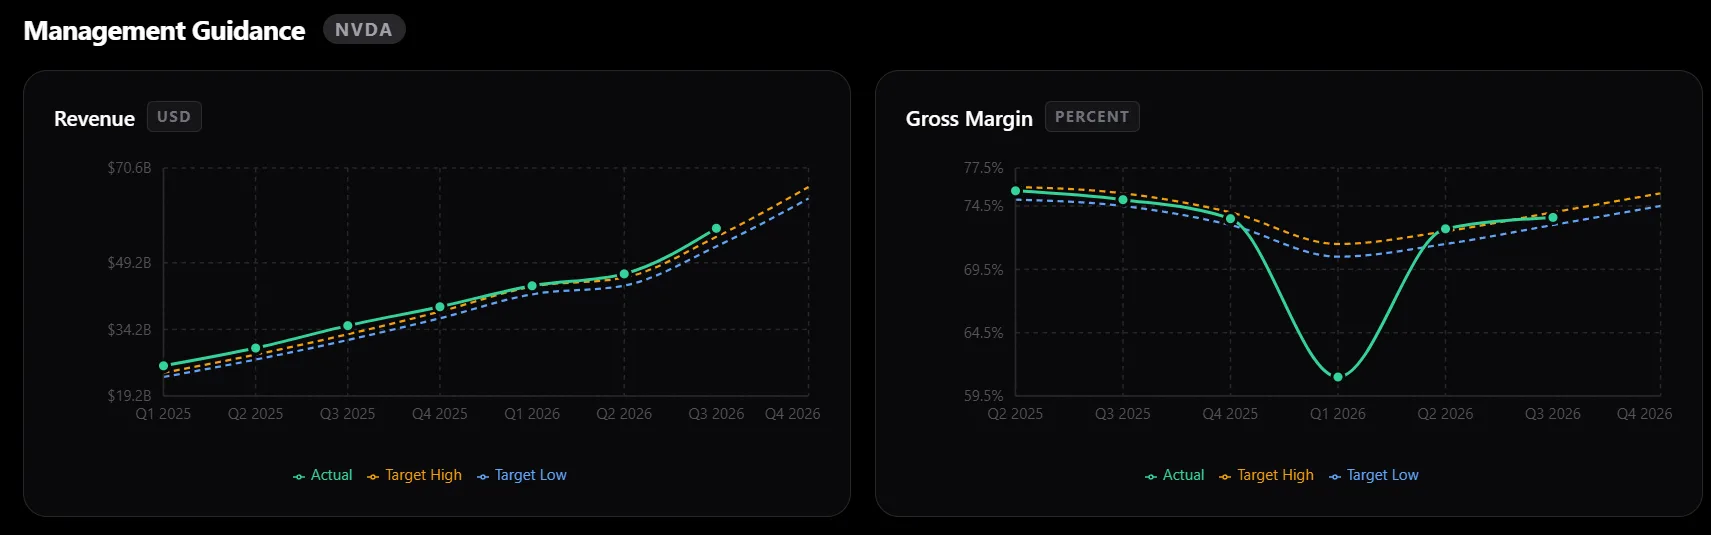
Fig 3: Quarter-over-quarter chart of guided ranges plotted against actual outcomes.
The accompanying report goes beyond the numbers. It tracks how management's tone has shifted over time, flags items where commitments have been kept and where they have slipped, and surfaces the second-order implications for the business — capacity decisions, capital allocation shifts, and segment-level execution risk that might otherwise be buried in the prepared remarks.
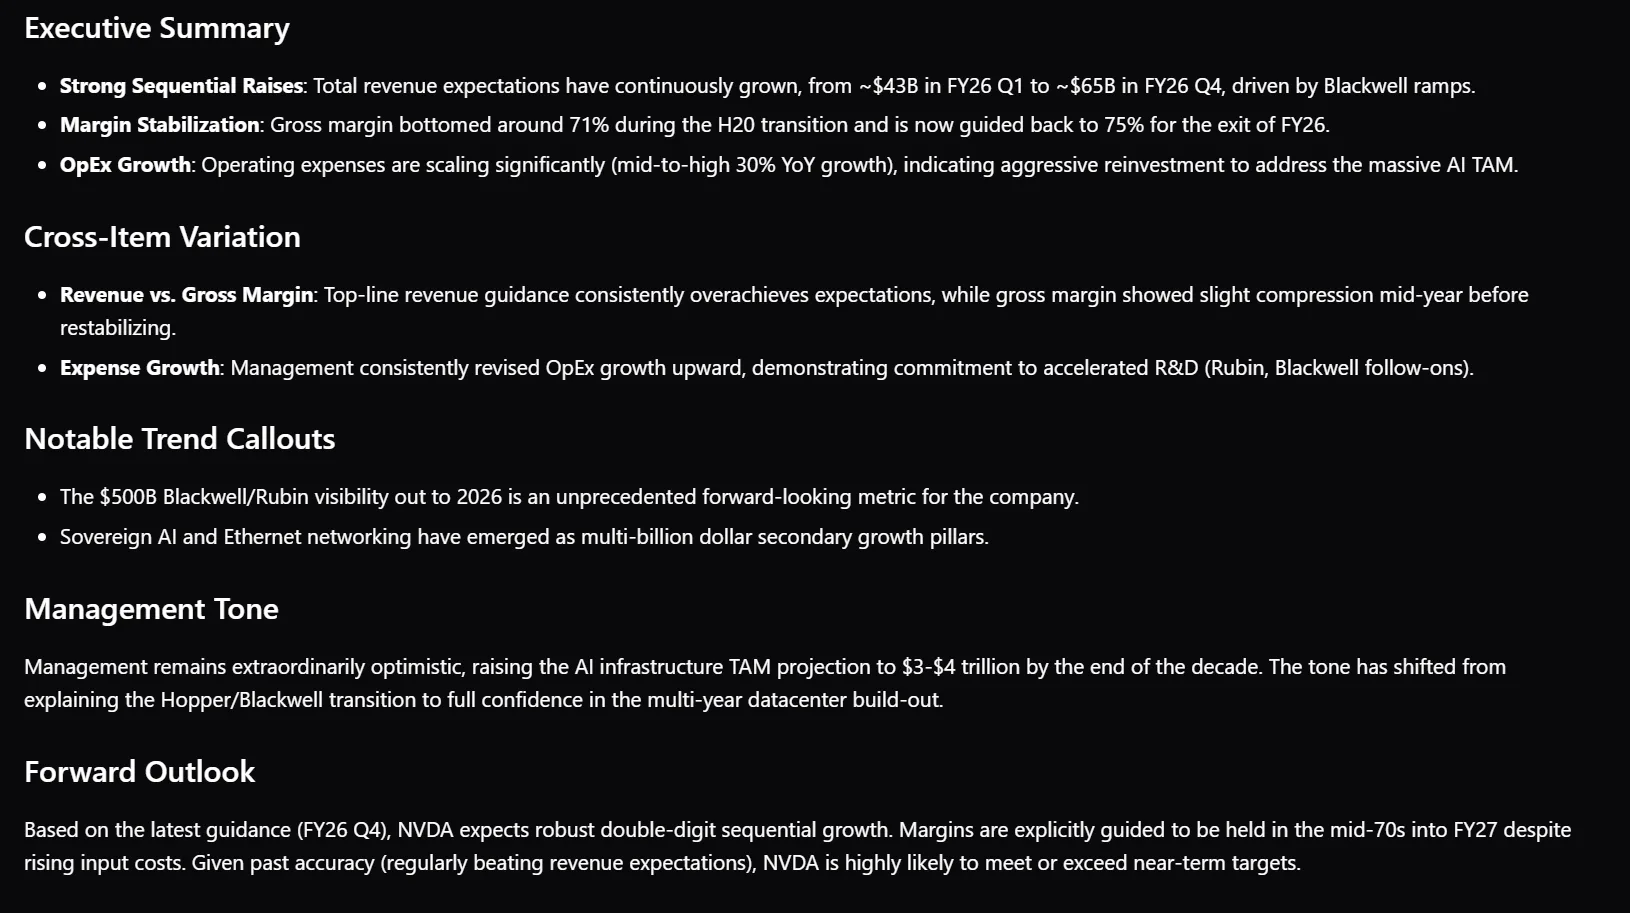
Fig 4: Snippet of written report summarising tone shifts, target adherence, and forward implications.
Other Factors We Capture
Year-over-year changes. Sequential, quarter-over-quarter comparisons can be misleading for businesses with strong seasonality. For every numerical item, we also capture the YoY change so users can see how the business has actually evolved on a like-for-like basis, rather than reacting to noise driven by the calendar.
Importance scoring. Not every guidance item carries the same weight. As the LLM works through the transcript and press release, it assigns each item an internal importance score based on how materially it affects the business. The agent later uses this score to decide what makes it into the final report, keeping the output focused on the items that genuinely move the thesis.
Downstream Applications
The management guidance dataset is useful well beyond financial modelling and position sizing. A few directions we are exploring:
- Cross-management bias scoring. With predictions and results stored across many quarters and companies, we can compute a bias score per management team and compare it directly against sector peers. The output is a quantitative read on which teams are reliable communicators of forward expectations — a signal that has historically lived only in analyst intuition.
- Sector-wide comparisons. YoY changes on a consistent set of items make it straightforward to benchmark companies within a sector. Comparing AMD and NVDA on YoY revenue growth, for instance, gives an immediate read on which is gaining share — without the manual work of aligning two differently-formatted disclosures by hand.